VAR
Publié le 22/05/2020

Extrait du document
«
Introduction to VAR' method
A.
Bendriouch
Definition of VAR's method
VAR summarizes the predicted maximum loss (or worst loss) over a target horizon within a given confidence
interval.
The procedure of VAR's method
The method VAR is based on statistical risk measures.
Statistical risk measures summarize risk by constructing a
probability distribution for an uncertain event, and then summarizing the distribution with one or more statistics.
For example, value at risk is a statistical risk measure that summarizes the market risk of a portfolio (i.e.
the
financial risk of uncertainty in the future market value of a portfolio).
A probability distribution is constructed for the portfolio's profit/loss over a specified horizon.
Value at risk is then
reported as the upper bound on a confidence interval for the portfolio's loss.
Risk measures such as expected credit
exposure are used for estimating pre-settlement credit exposure.
In practice, the time horizon that is used is often one day or one month.
Typically, the summary statistic
is the upper bound on a confidence interval for how much the portfolio might lose over the specified
horizon.
Occasionally, however, another statistic such as the standard deviation of profit/loss is used.
Probability Distribution
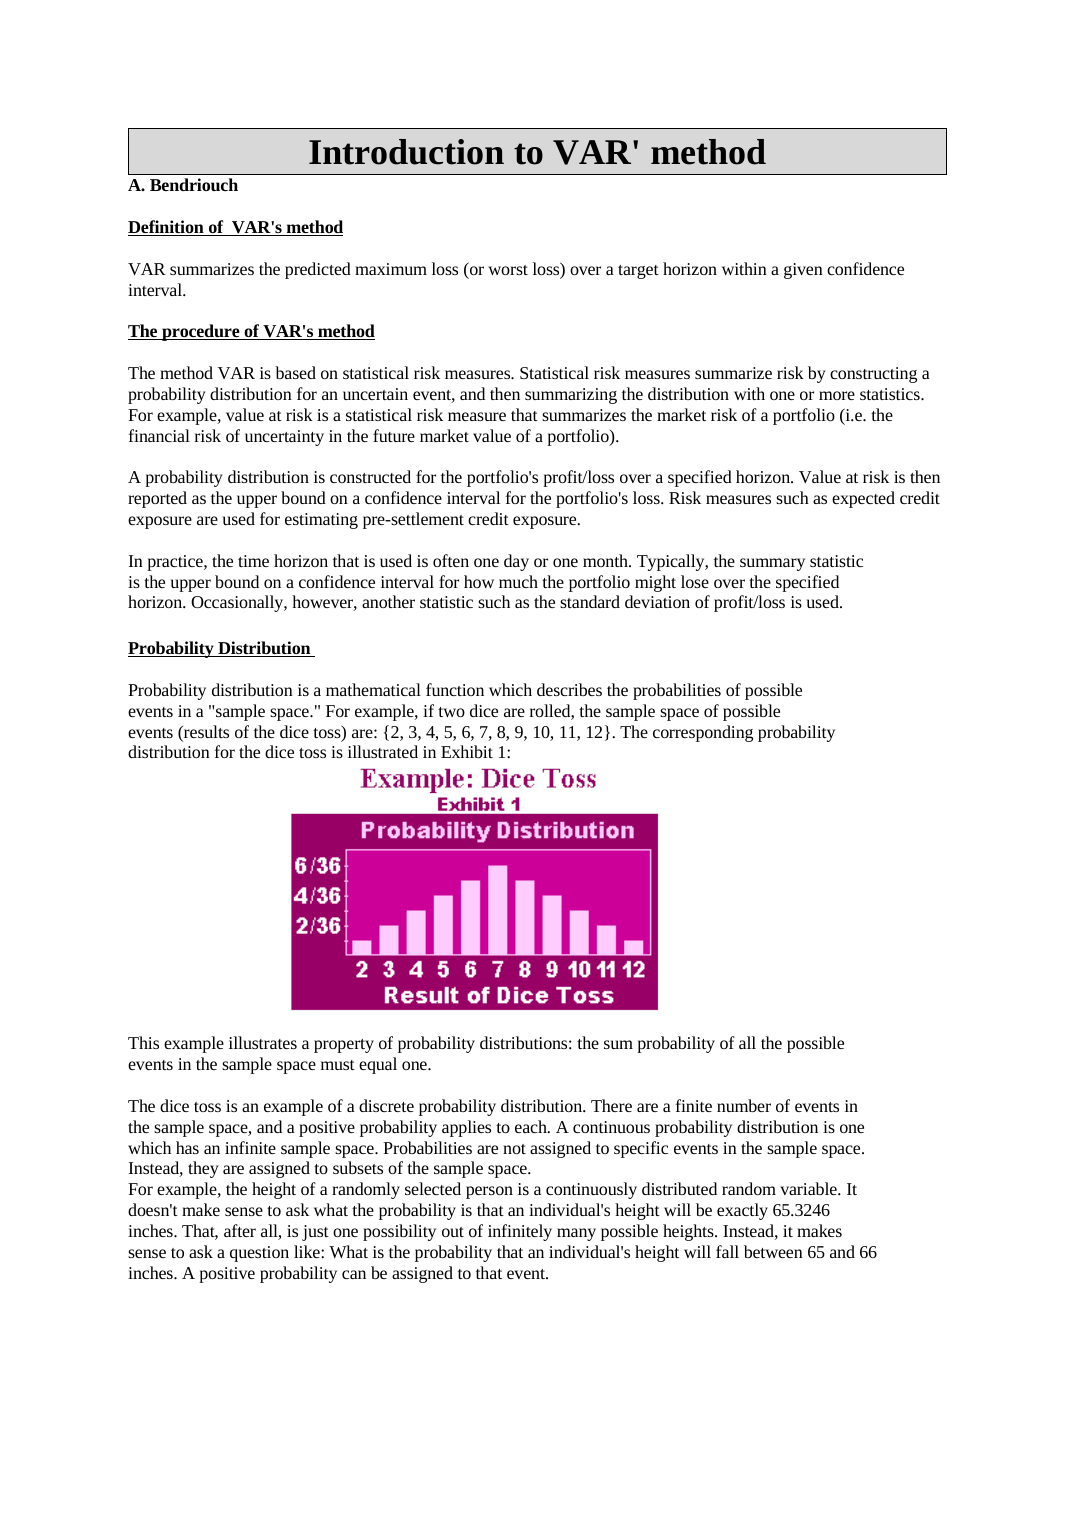
Probability distribution is a mathematical function which describes the probabilities of possible
events in a "sample space." For example, if two dice are rolled, the sample space of possible
events (results of the dice toss) are: {2, 3, 4, 5, 6, 7, 8, 9, 10, 11, 12}.
The corresponding probability
distribution for the dice toss is illustrated in Exhibit 1:
This example illustrates a property of probability distributions: the sum probability of all the possible
events in the sample space must equal one.
The dice toss is an example of a discrete probability distribution.
There are a finite number of events in
the sample space, and a positive probability applies to each.
A continuous probability distribution is one
which has an infinite sample space.
Probabilities are not assigned to specific events in the sample space.
Instead, they are assigned to subsets of the sample space.
For example, the height of a randomly selected person is a continuously distributed random variable.
It
doesn't make sense to ask what the probability is that an individual's height will be exactly 65.3246
inches.
That, after all, is just one possibility out of infinitely many possible heights.
Instead, it makes
sense to ask a question like: What is the probability that an individual's height will fall between 65 and 66
inches.
A positive probability can be assigned to that event..
»
↓↓↓ APERÇU DU DOCUMENT ↓↓↓
Liens utiles
- Var (fleuve).
- Port-Cros - Var
- Var (83).
- Théo van Rysselberghe1862-1926Peintre de portraits, paysages, compositions décoratives, né à Gand, mort à Saint-Clair(Var), élève des Académies de Gand et Bruxelles, il voyagea beaucoup.


